Welcome to the October addition of the Thesan Private Wealth update. With the recent escalations in the Middle East, I thought it would be appropriate to address how geological event impact the share market. Along this this, provide some commentary on what we expect to occur over the coming months, followed by an educational piece covering a topic that I get asked many times, and rightly so… that being, how much superannuation should you have.
Economic Outlook
Navigating September’s Surprises in Financial
September has indeed been an intriguing month for global financial markets, contrary to my initial predictions. I anticipated a downturn based on three primary factors:
- September’s Historical Patterns: Traditionally, September has been the least favourable month for the S&P 500, averaging a slight decline over the past 25 years.
- Geopolitical Tensions: With ongoing conflicts in Eastern Europe and the Middle East, alongside the uncertainty surrounding the US elections, risks seemed heightened.
- Federal Reserve Expectations: A 25bps interest rate cut was widely expected and considered already factored into market prices.
However, the markets had different plans. Despite escalating tensions in the Middle East, markets defied expectations, aided by a surprise 50bps cut from the Fed, ending the month approximately 2% higher. The ASX200 mirrored this trend with a 2.2% rise. This leaves us pondering the market’s trajectory for October. I maintain my view from August that we may see volatility with a potential downward trend until month’s end. Yet, certain elements could bolster the market through the year-end. Let’s explore the key forces at play as we move into October.
Tailwinds
Easing Monetary Policy
The Federal Reserve continues to lean towards dovish policies, as recent remarks by Chair Powell suggest an attempt to temper enthusiasm for rate cuts. Australia follows suit, albeit with a cautious stance due to persistent inflation concerns. Current market forecasts suggest a potential 50bp cut in the US before year-end, with a slight chance of 75bps. Australia, too, has a 50% chance of a 25bps cut before year-end and is likely to see another in early 2025. Historically, when the Fed initiates an easing cycle outside of a recession, markets have seen an average return of 8% over the next three months, increasing to 12% in six months. This pattern has occurred seven times since 1970, each time resulting in a 12-month average market gain of 15%.
China Stimulus
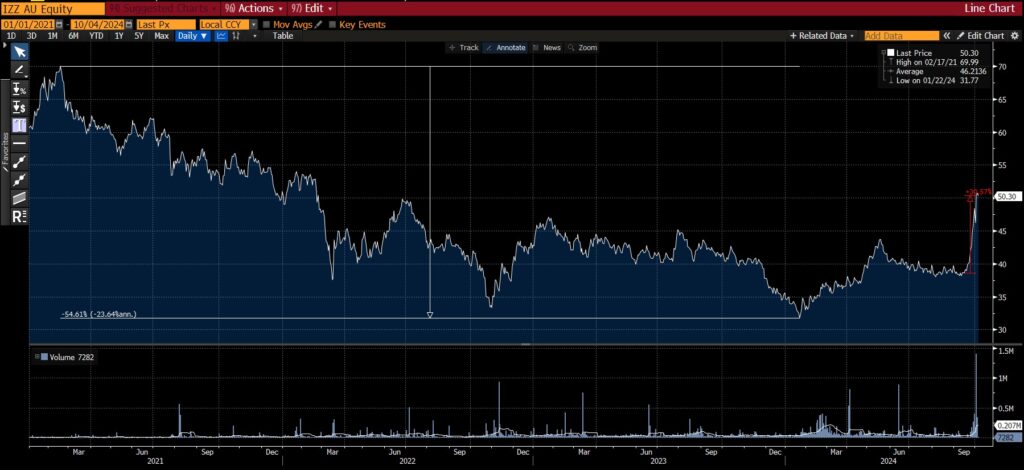
Unexpected announcements from the People’s Bank of China brought expansionary policies that caught the markets by surprise. While I believe China’s long-term outlook is marred by demographic challenges, resource insecurity, and centralised control, recent policy shifts have had a positive impact. The Chinese large-cap ETF (IZZ) illustrates this, recovering 30% following a 54% decline since early 2021. While we’ve seen false dawns from China’s economy before, it will be interesting to watch how this reaction unfolds in the coming weeks.
Sideline Cash
There’s an estimated $6 trillion sitting idle in US money market accounts. As interest rates decrease, the opportunity cost of holding cash may prompt investors to reallocate funds into equities, potentially driving stock prices higher. The timing of this shift is uncertain, but it’s a trend worth monitoring as rates continue to fall.
Headwinds
Geopolitics
Markets thrive on certainty, something that’s in short supply amidst global conflicts. The potential for further military actions in regions like the Middle East, where tensions are high, adds layers of unpredictability. For example, any escalation involving Iran, especially concerning its oil infrastructure, could have wide-reaching economic implications. It’s difficult to see an Israeli strike on Iran without US support. Oil has been resilient given the US (not Saudi Arabia) is now the world’s largest producer of crude oil, although we did see a 5% move last night as Israel/US consider a possible strike on Iran’s oil operations. Iran is particularly susceptible to a strike on its oil operations, as a majority of its oil infrastructure is located on Kharg Island in the Persian Gulf. Military strikes on Iranian oil infrastructure is a double-edged sword – it’ll hurt the Iranian economy but it will help the Russian economy, and hurt Western consumers. It doesn’t exactly assist central banks with their fight against inflation either. Again, the market hates uncertainty.
US Elections
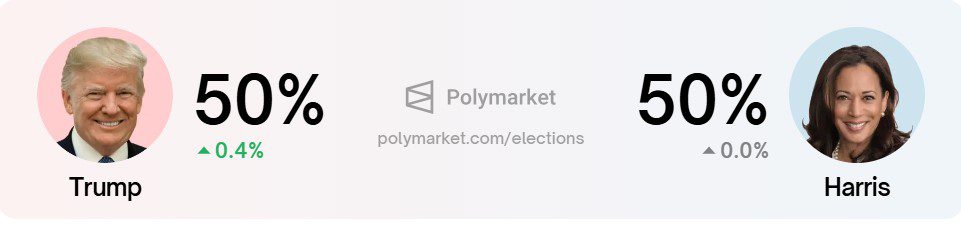
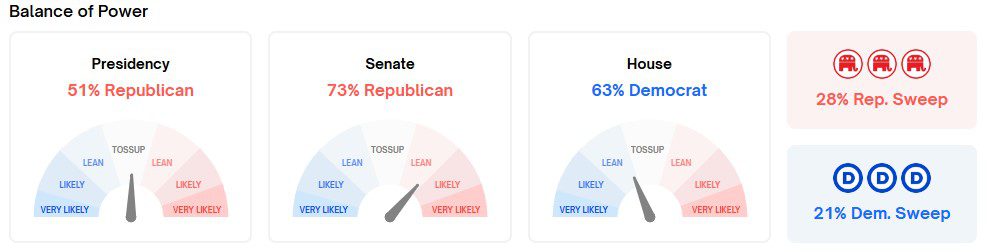
October represents the final stretch before the US elections in early November. Although I previously predicted a Trump victory, the race appears much tighter now, with both Trump and Harris neck and neck in recent polling. The market’s preference for legislative gridlock suggests a preference for stability, which seems plausible given the current political landscape. At this stage, it appears that gridlock will happen, and neither party will both Congress and the Presidency.
October & Earnings Season
Historically, October hasn’t been kind to equities, much like September. With the quarterly earnings season kicking off, investor focus will shift to corporate performance, particularly in the tech sector, where AI investments might delay expected returns. Uncertainty during this period could lead to market fluctuations.
In conclusion, while the markets in September defied expectations, the landscape remains dynamic. Despite uncertainties, I’m optimistic about market prospects as we approach year-end. The resolution of current uncertainties should provide clearer insights, setting the stage for potential growth in November and beyond.
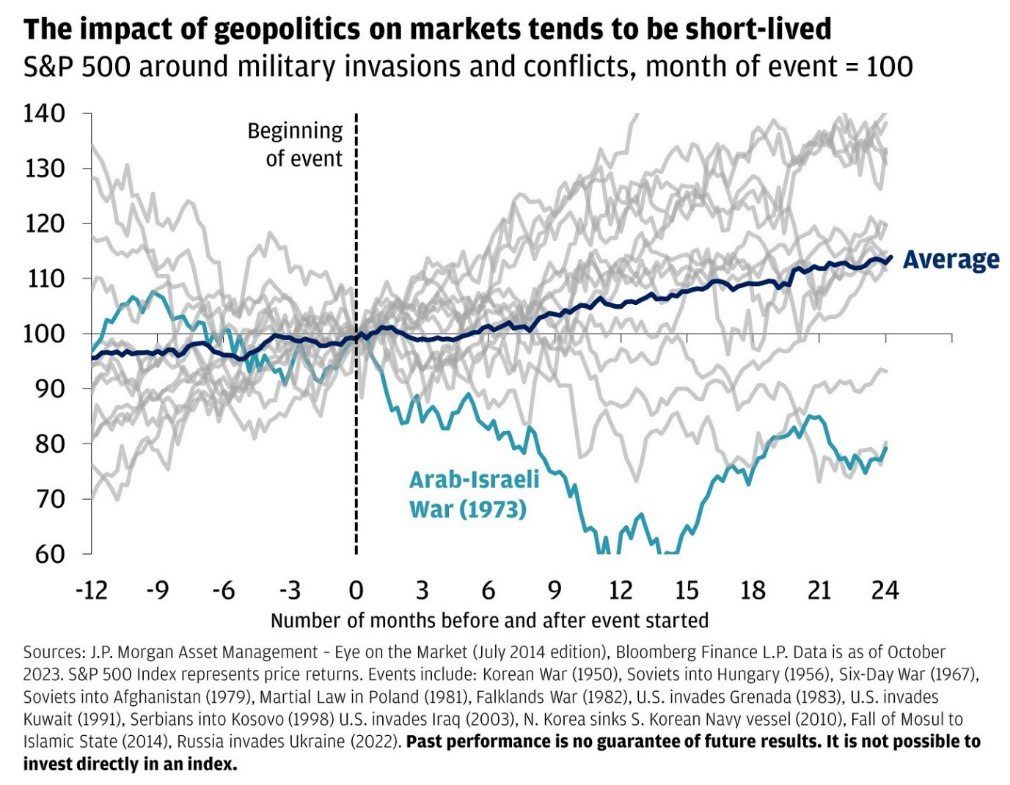
The Ripple of Geopolitical Events on Markets
Geopolitical events can often feel like seismic shifts, especially to investors tracking the pulse of the markets. With more than 50 nations heading into elections this year and conflicts persisting in Europe and the Middle East, geopolitical concerns resonate loudly among those planning their financial futures. But how do these global tremors impact market returns? The connection isn’t as straightforward as one might think.
Lessons from the Past
Let’s take a historical walk through significant geopolitical events, starting with Germany’s invasion of France in 1940 and closing with Russia’s recent offensive in Ukraine. An analysis of equity market performance three, six, and twelve months post-event reveals intriguing insights. While initial three-month returns tend to underperform, the six and twelve-month marks tell a different tale—returns align nearly identically with periods sans significant geopolitical turmoil. For the average equity investor, it’s like the event barely left a mark.
Average real S&P 500 return vs. average real S&P 500 return after geopolitical events
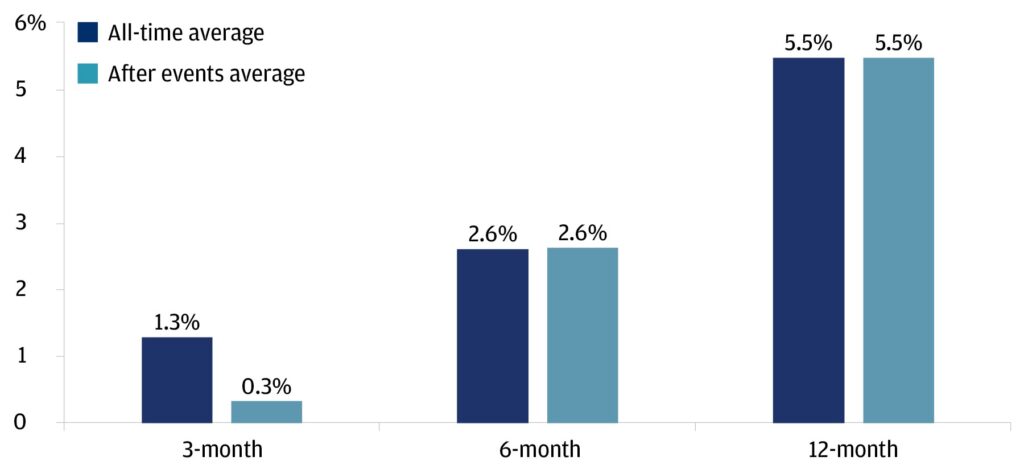
Sources: Robert Shiller, Haver Analytics. Data as of December 31, 2023. Note: Return refers to price return. Geopolitical events in the above chart refer to 36 events selected from 80 years of geopolitical events beginning with Germany’s invasion of France in 1940 and ending with the war in Ukraine in 2022. We measured the 3-month, 6-month and 12-month returns following these events.
Geopolitical Shocks and Their Fleeting Market Impact
Despite the seemingly short-lived market impact of geopolitical events on global equities, we shouldn’t dismiss them entirely. While large-cap, globally diversified markets may show resilience, the local story is often more turbulent.
Gold’s Shimmer in Uncertain Times
While geopolitical shocks rarely leave lasting dents in global equity markets, they can cause immediate drawdowns in stocks and bonds. Here, gold emerges as one of the more reliable hedges against such volatility, but without the income yield.
What This Means for Investment Strategies
While some worries about the market implications of geopolitics may be exaggerated, ignoring them is not an option. Though history suggests that geopolitical events don’t have lasting impacts on globally diversified equities, their influence on some local markets can be substantial.
Something to consider with investments that we manager for you. We do not heavily concentrated in specific markets, or recommend you own a significant stake in a local business. We recommend our clients hold mainly large-cap companies and diversify globally. This is order to help reduce the negative impact of not just global geopolitical events, but local ones also.
However, for those keen on buffering against the short-term volatility that geopolitical shocks can introduce, adding gold to your portfolio could be a savvy strategy. You will need to consider several things though: the current price of gold at the moment, along the costs for selling down investments, like capital gain tax. If you are concerned, please reach out and we can talk to your specific situation and needs.
 In navigating the uncertainties of geopolitics, it’s crucial to balance awareness with action. By understanding the nuances of market reactions and strategically positioning investments, you can better weather the storms and seize the opportunities they bring.
Education Section
How much should I have in my super?
Looking at average superannuation balances for your age may be misleading
Exploring how much you should have in your superannuation account is not just about crunching numbers—it’s about setting yourself up for a comfortable retirement that suits your unique lifestyle.
Understanding the Bigger Picture
Comparing your super balance against others of your age might seem tempting, but this approach often misses the mark. Many industry super funds publish average balances, but these figures are more about satisfying curiosity than providing actionable insights. In reality, each person’s retirement goals and pre-retirement lives are different, making these averages a poor benchmark for everyone. This means that looking at average super balances is a redundant exercise.
There are however, a few insights that you can garner from the ‘average super balance for your age’ tables. Here’s an example of a table below.
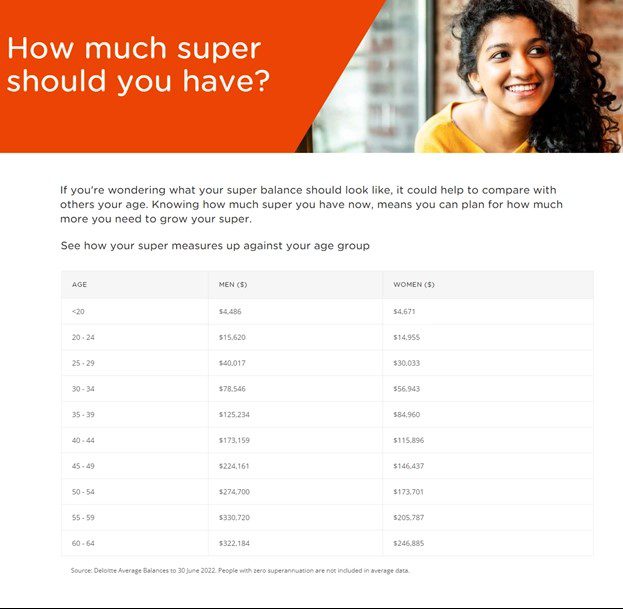
Source: AustralianSuper website
These tables do reveal some striking trends. Women typically have lower super balances compared to men, largely due to career breaks for caregiving responsibilities. Additionally, balances tend to decrease in older age brackets, reflecting a time when superannuation wasn’t as prevalent among older Australians. This historical context serves as a reminder for younger investors planning for retirement.
Start with Your Retirement Expenses
To tailor a comparison that’s meaningful, look at your expected retirement expenses rather than average balances. Think about how your spending might shift when you retire. While you’ll save on work-related costs—like commuting and daily lunches—you’ll likely spend more on leisure activities and travel, especially at the start.
It’s also essential to consider the tax environment of superannuation. For instance, assets up to $1.9 million in super can have tax-free earnings. Tools like paycalculator.com.au can help you estimate your post-tax salary and guide your calculations.
A Dollar Today vs. Tomorrow
When planning for retirement, it’s vital to account for inflation. A dollar today won’t have the same purchasing power in 30 years. While current high inflation rates can be alarming, long-term expectations are around 2.8%. Your personal inflation rate might differ, especially if you’ve already paid off major expenses like a home.
If you’re early in your career, anticipate salary increases alongside lifestyle changes. Regularly reviewing and adjusting your financial goals is crucial to staying on track.
Calculating Your Retirement Needs
After estimating your retirement needs, it’s time to calculate the lump sum required. Divide your expected annual expenses by your chosen withdrawal rate. For example, if you need $70,000 annually and use a 4% withdrawal rate, you’ll need a $1.75 million portfolio. This figure can be adjusted over time as life unfolds.
$1,750,000 is significantly more than what the latest Retirement Standard document from the Association of Super Funds of Australia (ASFA) states. They believe that the average superannuation balance needed for a 67-year-old to have a comfortable retirement is $690,000 for a couple and $595,000 for a single person.
The assumption with this figure is that the retiree/s will also receive a part of the Age Pension. With a 4% withdrawal from $595,000, the total income for a single retiree that isn’t a homeowner is $48,316.7 per year.

Creating Your Personalised Super Chart
Estimate the portfolio size needed for retirement to construct your personal super chart. Use tools to input your future portfolio value, years until retirement, estimated returns, and savings plans. This personalised approach offers a clearer picture of your progress over time.
What’s Next?
With your retirement target in mind, you can begin building a portfolio that aligns with your goals. We have numerous resources to support you on this rewarding journey. Remember, having a plan—and the flexibility to adjust it—is far more effective than having no plan at all. So, take the time to understand your retirement expenses, inflation, and portfolio needs. Your future self will thank you.
Additional Considerations
In addition to understanding your retirement expenses and creating a personalised super chart, there are other factors that may impact how much you should have in your superannuation account. These include your risk tolerance, investment strategy, and any additional income sources such as rental properties or inheritance.
It’s important to regularly review and reassess these factors as they may change over time. Consulting with us will be helpful in determining the best course of action for your individual situation.
Ultimately, the key is to stay informed about your superannuation account and make adjustments as needed to ensure you are on track for a comfortable retirement. By taking these steps and being proactive in your financial planning, you can have peace of mind knowing that your super balance is working for you and your future. So don’t just settle for the average or vague estimates—take control of your retirement planning and create a personalised strategy that aligns with your unique goals and lifestyle. Your future self will thank you for it!
Stay Connected
Please follow us on LinkedIn and Facebook by clicking on the below links.


Please take the time to review us on Google by clicking on the link below –

Want to know more?
Thank you again for your trust in us and your loyalty, if you’d like to discuss any of the content in this update and how it may impact you, please call me on 07 3709 8485. If you know of anyone that you feel will benefit from meeting with us, please don’t hesitate to send them our details.